Sunday, 16 November 2025

Why the simplest explanation is always the best


Preamble

The simplest explanation is always the best among the explanations that are representative.  It is called the principle of parsimony,  Occam's razor. It is the bedrock of scientific enlightenment. There is a recent development that people start to do a category error to discard this principle based on the following setting that lead to misunderstanding: if we say that the simplest model that can explain the data in one representation but another representation requires a more complex model, then we are choosing more complex model. This is obviously wrong. The simplest explanation is to be chosen from the models that captures the complexity on the given representations, not the simplest over both representations. Filter explanations first based on representations then selection follows. Here we shown the core idea via an illustrative example. 
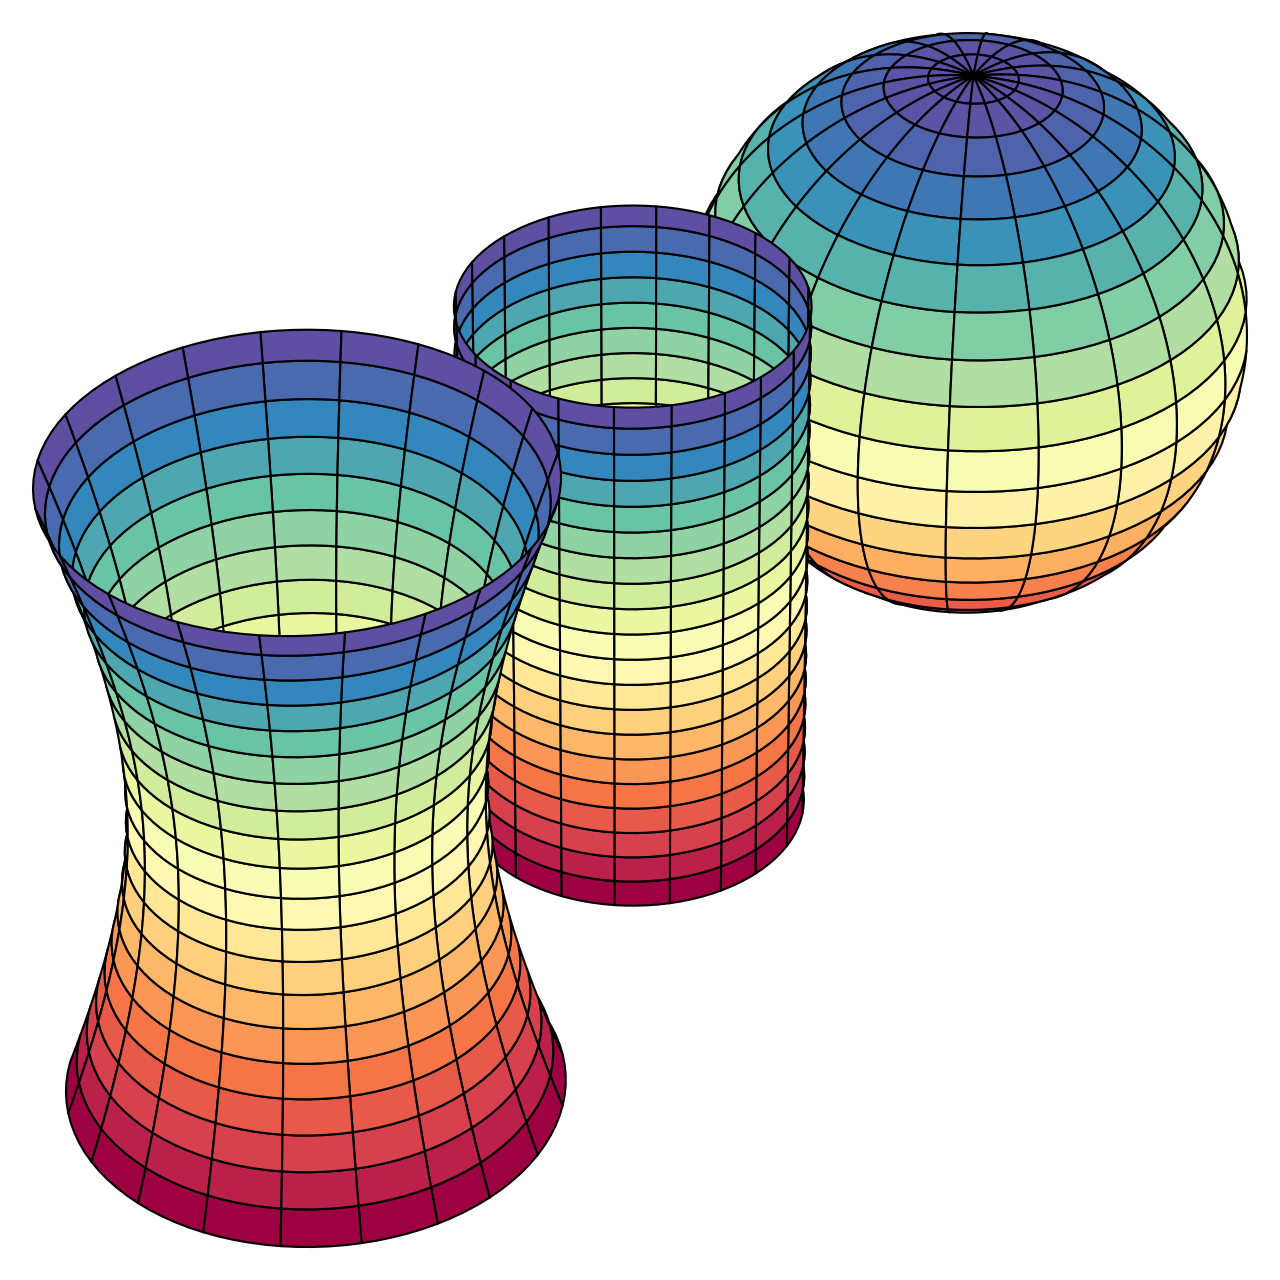
Pearson coefficient for circle is zero (Wikipedia)


Revisiting Occam’s Razor: A case of correlation and geometry


In order to understand this category error, we will work on a concrete example. Let's say we have a data, which is a circular shape $\mathscr{D}(x, y)$, as in figure. We have 3 models: 

$$\mathscr{M}_{1} : y = a x + b $$
$$\mathscr{M}_{2} : y = \sqrt{1-x^{2}} $$
$$\mathscr{M}_{3} : y ~ NN(x)  $$

And $\mathscr{U}$ a utility function, Pearson correlation $C(x, y)$.  We consider performance measure in ranking for the utility and a measure of representation. $\mathscr{M}_{3}$ is a neural network with a lot of parameters.

There is no error in choosing $\mathscr{M}_{1}$ based on the similar correlations these models produce. Principle of parsimony is not violated at all.  This is correct if we are only considering numerical representation. Pearson correlation as a utility works well for purely numerical representation. What about geometric representation? Then we need to change our utility function (representation measure or performance function). 

Let's say if we use curvature as a utility, $\kappa(x,y)$, in this case $\mathscr{M}_{1}$ fails to capture curvature and its is filtered out before Occam's razor can be applied. Then we left with  $\mathscr{M}_{2}$ and $\mathscr{M}_{3}$ . 

Correlation and geometric explanations are two different things. Two vastly different geometries can produce the same correlations.  A model can be quite good in explaining correlation but fails to capture geometric complexity. In this setting, it does not mean that Occam's razor is wrong. We need to apply Occam's razor across representations: numeric, geometric, algebraic, or symbolic, depending on the purpose. Always keep in mind the purpose or utility of model when invoking Occam's razor. Simplest explanation over the required representations that are relevant are the best. 

On the utility, performance and representations measure

Performance function, representation measure and utility functions can be different in real life, here for illustration purposes we consider them interchangeably. 

Conclusion

Nature minimises cost over complexity but under utility constraints. Minimal cost without satisfying utility or representation measure won't be chosen despite being the simplest. We need to filter first based on utility or representation measure before applying Occam's razor. The simplest explanation is always the best among the explanations that are representative. 


 Cite as 

 @misc{suzen25occam, 
     title = { Why the simplest explanation is always the best}, 
     howpublished = {\url{https://science-memo.blogspot.com/2025/11/simplest-explanation-always-best.html}}, 
     author = {Mehmet Süzen},
     year = {2025}
}  


Tuesday, 3 June 2025

Compressive algorithmic randomness:
Gibbs-randomness proposition for massively energy efficient deep learning

Figure: Dual Tomographic Compression
Performance, Süzen, 2025.
Preamble

Randomness is elusive and its probably one of the outstanding concepts for human scientific endeavour, along with gravity. Kolmogorov complexity, appears to be so novel in trying to answering "what is randomness?". The idea that the length of the smallest model that can generate the random sequence determines its complexity was a turning point in history of science. Similarly, it implies choosing the simplest model for explaining a phenomenon. That's why Kolmogorov's work was also supported by the ideas of Solomonoff and Chaitin. A recent work, explores this algorithmic information from compression perspective with Gibbs entropy.

A strange tale of path from applied research to fundamental proposition. 

During study of model compression algorithm development, I have noticed an amazing behaviour that information, entropy and compression over compression process have a more in depth. 

New concepts in compression and randomness via train-compress cycles

Here, we explain the new concepts for both deep learning model compression and on the interplay between compression and algorithmic randomness.

Inverse compressed sensing (iCS): Normally CS procedure is applied to reconstruct an unknown signal with fewer measurements. In the case of deep learning train-compress, weights are known at one point in the training cycle. If we create hypothetical measurements, using CS formulations, we can reconstruct weights sparse projection. 

Dual Tomographic Compression: Applying iCS for the input and output of neuronal level, layer-wise, simultaneously.  

Weight rays:  An output reconstructed vector out of DTC; weights given sparsity level, though they are not generated in isolation but within train-compress cycle.

Gibbs randomness proposition : An extension of Kolmogorov complexity for a compression process. That, directed randomness is the same as complexity reduction, i.e., compression. 

Conclusion 

A new technique called DTC can be used to train deep learning with model compression on the fly. This gives rise to massively energy efficient deep learning, reaching almost ~98% reduction in energy use.  Moreover, the technique also demonstrated an extended version of Kolmogorov complexity. 

Further reading 

Paper & codes are released :


Cite as 

 @misc{suzen25car, 
     title = {Compressive algorithmic randomness: <br>Gibbs-randomness proposition for massively energy efficient deep learning}, 
     howpublished = {\url{ https://science-memo.blogspot.com/2025/06/compressive-algorithmic-randomness.html}}, 
     author = {Mehmet Süzen},
     year = {2025}
}  

Tuesday, 22 April 2025

Ultimate physical limit of data storage:
Connecting Bekenstein Bound to Landauer Principle

Preamble 
Bekenstein's Information
(Wikipedia)

Black holes are not too esoteric anymore after LIGO's success and successful imaging efforts. Their entropy behaves much different than the entropy of an ordinary matter. This leads to incredible discovery of so called holographic principle. The principle stating that we live on a projection of higher-dimensional manifestation of universe. On the other hand, Landauer made silently a discovery on energy expenditure of keeping information processing reversible. Similar bound put forward by Bekenstein for black holes made Landauer-Bekenstein bound for quantum gravity a natural avenue to study. 

What is the Bekenstein Bound?

Basically, this puts limits the size of a black hole, via its entropy bound. Essentially it states that, entropy of a black hole $S$ is bounded with the radius of the black hole $R$ and Energy $E$, other constants being 1, 

$$S \le R \dot E$$

What is Landauer Principle?

A limit on any process wants to delete 1 bit of information,  has to dissipate energy proportional to its temperature, 

$$ E \ge T ln 2$$ 

Again we made the constants to 1. 

Physical limit of data storage: 1 BekensteinBytes

Using both Bekenstein bound and Landauer principle one can compute the a physical limit for a data storage on a unit sphere,

$$S \sim T$$

If we scaled this with inverse of Planck area $\ell_{p}$; One bit of information proportional to Planck area and maximum attainable temperature $10^{32}$ K is scaled with this. The final value corresponds to $\approx 10^{100}$ bits. This again corresponds to about 10 Giga-Quetta-Quatta-Quatta bytes (1 Quetta byte is $10^{30}$ bytes). 

At this point in time, we can propose that $10^{100}$, would be to call 1 BekensteinBytes.  However with more fine-grain computations, the number may change. Our purpose here is to give a very rough idea about the scale of ultimate physical limitations of data storage in BekensteinBytes.

Bekenstein Information Conjecture : One cannot compress more than 1 BekensteinBytes on a smallest patch of space.

Outlook

An interesting connections in quantum gravity and computation, provides certain physical limitations on how much information we can be stored at a given unit space.  We called this Bekenstein Information Conjecture. 

Further reading

Cite as 

 @misc{suezen25datalimit, 
     title = {Ultimate physical limit of data storage: Connecting Bekenstein Bound  to Landauer Principle}, 
     howpublished = {\url{https://science-memo.blogspot.com/2025/04/ultimate-physical-limit-of-data-storage.html}}, 
     author = {Mehmet Süzen},
     year = {2025}
}  


Friday, 26 April 2024

Basic understanding of a metric tensor:
Disassemble the concept of a distance over Riemannian Manifolds

Preamble 

Gaussian Curvature (Wikipedia)
One of the core concepts in Physics is so called metric tensor. This object encodes any kind of geometry. Combined genius of Gauß,  Riemann and their contemporaries lead to such a great idea, probably one of the achievements of human quantitative enlightenment. However, due to notational aspects and lack of obvious pedagogical introduction, making object elusive mathematically. Einstein's notation made this more accessible but still, it requires more explicit explanation.  In this post we disassemble the definition of a distance over any geometry with an alternate notation. 

Disassemble distance over a Riemannian Manifolds

The most general definition of a distance between two infinitesimal points on any geometry, or a fancy word for it, is a Riemannian Manifolds, is defined with the following definitions. Manifold is actually a sub-set of any geometry we are concerned with and Riemannian implies a generalisation.

Definition 1: (Points on a Manifold) Any two points are defined in general coordinates $X$ and $Y$,  They are defined as row and column vectors respectively. In infinitesimal  components. $X = [dx_{1}, dx_{2}, ..., dx_{n}]$ and $Y= [dx_{1}, dx_{2}, ..., dx_{m}]^{T}$. 

Geometric description between two points are defined as tensor product, $\otimes$, that is to say we form a grid, on the geometry. 

Definition 2: (A infinitesimal grid) A grid on a geometry formed by pairing up each point's components, i.e., a tensor product. This would be a matrix $P^{mn}$, (as in points), with the first row $(dx_{1} dx_{1},.....,dx_{1} dx_{n})$ and the last row $(dx_{m} dx_{1},.....,dx_{m} dx_{n})$.

Note that grid here is used as a pedagogical tool, points are actually leaves on the continuous manifold. Now, we want to compute the distance between grid-points, $dS^{n}$, then metric tensor come to a rescue

Definition 3: (Metric tensor) A metric tensor $G^{nm}$ describes a geometry of the manifold that connects the infinitesimal grid to distance, such that $dS^{n}=G^{nm} P^{mn}$.

Note that, these definition can be extended to higher-dimensions, as in coordinates are not 1D anymore. We omit the square-root on the distance, as that''s also a specific to L2 distance.  Here, we can think of $dS^{n}$ a distance vector, and $G^{nm}$ and $P^{mn}$ are the matrices. 

Exercise: Euclidian Metric

A familiar geometry, metric for Euclidian space, reads diagonal elements of all 1 and rest of the elements zero. How the above definitions holds, left as an exercise. 

Conclusion 

We have discuss that a metric tensor, contrary to its name, it isn't a metric per se but an object that describes a geometry, having magic ability to connecting grids to distances. 

Further reading

There are a lot of excellent books out there but a classic Spivak's differential geometry is recommended. 

Please cite as follows:

 @misc{suezen24bumt, 
     title = {Basic understanding of a metric tensor: Disassemble the concept of a distance over Riemannian Manifolds}, 
     howpublished = {\url{https://science-memo.blogspot.com/2024/04/metric-tensor-basic.html}, 
     author = {Mehmet Süzen},
     year = {2024}
}  

Friday, 10 November 2023

Mathematical Definition of Heuristic Causal Inference:
What differentiates DAGs and do-calculus?

Preamble 

Experimental design is not a new concept and randomised control trials (RCTs) are our solid gold standard of doing quantitative research, when no apparent physical laws are available to validate observations.  However, it is very expensive to design RCTs, not ethical or either not possible due to logistical reasons in some cases. Then we fall into Causal Inference's heuristic frameworks, such as potential outcomes, matching, and time-series interventions in imagining counterfactuals and interventions. These methods provide immensely successful toolbox for quantitative scientist where by systems do not have any known physical laws. DAGs and do-calculus, differentiates from all these approaches that try to move away from full heuristics. In this post we try to postulate this formally in mathematical terms in the context of causal inference over observational data framework. We established that DAGs and do-calculus bring  mathematically more principled way of practicing causal inference akin to theoretical physics attitude. 

Definition of Heuristic Causal Inference (HeuristicCI) : Observational Data 

Hume (Wikipedia)

Heuristics in general implies an algorithmic approximate solution, usually appear as numerical and statistical algorithms in causal inference whereby full RCT is not available. This can be formalised as follows, 

Definition (HeuristicCI) Given dataset of  $n-$dimensions $\mathscr{D} \in \mathbb{R}^{n}$ observation, having variates of $X=x_{i}$, with each having different sub-sets (categories within $x_{i}$), having at least one category of observations.  We want to test  causal connection between two distinct subsets of $X$,  $\mathscr{S}_{1} , \mathscr{S}_{2}$, given an interventional versions or imagined counterfactual where by at least one of the subset is available,  $\mathscr{S}_{1}^{int} , \mathscr{S}_{2}^{int}$. Using an algorithm $\mathscr{A}$ that processes dataset to test an effect size $\delta$ using a statistic $\beta$,  as follows, $$ \delta= \beta(\mathscr{S}_{1} , \mathscr{S}_{1}^{int})-\beta(\mathscr{S}_{2} , \mathscr{S}_{2}^{int})$$ statistic $\beta$ can be result of a machine learning procedure as well and difference in $\delta$ is only a particular choice, i.e., such as Average Treatment Effect (ATE). The algorithm  $\mathscr{A}$ is called  HeuristicCI.

Many of the non-DAGs and do-calculus methods directly falls into this category, such as potential outcomes, uplift, matching and synthetic controls.  This definition could be quite obvious to practitioners that has a good handle in mathematical definitions. Moreover, HeuristicCI  implies solely data-driven approach to causality inline with Hume's pure-empirical view-point. 

Primary distinction in practicing DAGs that it brings causal ordering naturally [suezen23pco] with scientist's cognitive process encoded, where by HeuristicCI search for statistical effect size that has a causal component in fully data-driven way. However, a HybridCI would entails using DAGs and do-calculus in connection with data driven approaches.

Conclusion

In this short exposition, we introduced HeuristicCI  concept that category of methods that do not use DAGs and do-calculus explicitly in causal inference practice. However, we do not put a well designed RCTs  in this category. Because, as a gold standard approach whereby properly encoded experimental design generates full interventional data reflecting scientist's domain knowledge. 

References and Further reading

Please cite as follows:

 @misc{suezen23hci, 
     title = {Mathematical Definition of Heuristic Causal Inference: What differantiates DAGs and do-calculus?}, 
     howpublished = {\url{https://science-memo.blogspot.com/2023/11/heuristic-causal-inference.html}, 
     author = {Mehmet Süzen},
     year = {2023}
}  

Postscript A: Why Pearlian Causal Inference is very significant progress for empirical science? 

Judea Pearl's framework for causality sometimes referred to as “mathematisation of causality”. However, “axiomatic foundations of causal inference” is fair identification, Pearl's contribution to the field is in par with Kolmogorov's axiomatic foundations of probability. Key papers of this axiomatic foundations are published in 1993 (back-doors) [1] and 1995 (do-calculus) [2].  


Original works of Axiomatic foundation for causal inference:

[1] Pearl, J., “Graphical models, causality, and intervention,” Statistical Science, Vol. 8, pp. 266–269, 1993. 

[2] Pearl, J., “Causal diagrams for empirical research,” Biometrika, Vol. 82, Num. 4, pp. 669–710, 1995. 

Saturday, 1 April 2023

Resolution of misconception of overfitting: Differentiating learning curves from Occam curves

Preamble 

William of Occam (Wikipedia)

A misconception that overfitted model can be identified with the  amount of generalisation gap between model's training and test sets over its learning curves is still out there. Even in some prominent online lectures and blog posts, this misconception is now repeated without critical look. In general, this practice unfortunately diffuse into some academic papers and industrial,  practitioners attribute poor generalisation to overfitting. We have provided a resolution of this via a new conceptual identification of complexity plots, so called Occam's curves differentiating from a learning curve. An accessible mathematical definitions here will clarify the resolution of the confusion.   

Learning Curve Setting: Generalisation Gap 

Learning curves explain how a given algorithm's generalisation improves over time or experience, originating from Ebbinghaus's work on human memory.  We use inductive bias to express a model, as model can manifest itself in different forms from differential equations to deep learning.

Definition: Given inductive bias $\mathscr{M}$ formed by $n$ datasets with monotonically increasing sizes  $\mathbb{T} = \{|\mathbb{T}_{0}| > |\mathbb{T}_{1}| > ...> |\mathbb{T}_{n}| \}$. A learning curve $\mathscr{L}$ for $\mathscr{M}$ is expressed by the performance measure of the model over datasets,  $\mathbb{p} = \{ p_{0},  p_{1}, ... p_{n} \}$, hence $\mathscr{L}$ is a curve on the plane of $(\mathbb{T}, p)$.  

By this definition, we deduce that $\mathscr{M}$ learns if $\mathscr{L}$ increases monotonically. 

A generalisation gap is defined as follows. 

Definition: Generalisation gap for inductive bias $\mathscr{M}$ is the difference between its' learning curve $\mathscr{L}$ and the learning curve of the unseen datasets, i.e., so-called training, $\mathscr{L}^{train}$. The difference can be simple difference, or a measure differentiating the gap.

We conjecture the following. 

Conjecture: Generalisation gap can't identify if $\mathscr{M}$ is an overfitted model. Overfitting is about Occam's razor, and requires a pairwise comparison between two inductive biases of different complexities.

As conjecture suggests that generalisation gap is not about overfitting, despite the common misconception. Then, why the misconception? The misconception lies on the confusion of how to produce the curve that we could judge overfitting. 

Occam Curves: Overfitting Gap [Occam's Gap] 

In the case of generating Occam curves, a complexity measure  $\mathscr{C}$  over different inductive biases $\mathscr{M_{i}}$ plays a role. Then the definition reads. 

Definition: Given $m$ inductive bias $\mathscr{M_{i}}$ formed by $n$ datasets with monotonically increasing sizes  $\mathbb{T} = \{|\mathbb{T}_{0}| > |\mathbb{T}_{1}| > ...> |\mathbb{T}_{n}| \}$. An Occam curve $\mathscr{O}$ for a given $\mathscr{M}$ is expressed by the performance measure of the model over complexity-dataset size points  $\mathbb{F} = [(|\mathbb{T}_{0}|, \mathscr{C}),  (|\mathbb{T}_{1}| , \mathscr{C}), ...,  (|\mathbb{T}_{n}| , \mathscr{C}) ] $; Performance of a given inductive bias reads $\mathbb{p} = \{ p_{0},  p_{1}, ... p_{n} \}$, hence Occam curve, $\mathscr{O}$ is a curve on the plane of $(\mathbb{F}, p)$.  
 
Given definition, producing Occam curves are more complicated than simply plotting test and train curves over batches. The ordering in $\mathbb{F}$ forms what is so-called goodness of rank.

Summary and take home

Resolution of misconception of overfitting lies in producing Occam curves to judge the bias-variance tradeoff, not the learning curves of a single model. 

Further reading & notes

  • Further posts and a glossary : The concept of overgeneralisation and goodness of rank.
  • Double decent phenomenon, it uses Occam's curves, not learning curves.
  • We use dataset size as an interpretation of increasing experience, there could be other ways of expressing a gained experience, but we take the most obvious evidence.
Please cite as follows:

 @misc{suezen23rmo, 
     title = {Resolution of misconception of overfitting: Differentiating learning curves from Occam curves}, 
     author = {Mehmet Süzen},
     year = {2023}
}  

Postscript notes

Take home messages

Understanding Generalisation Gap and Occam’s gap

Model selection and evaluations are usually confused by novice and as well as experienced data scientists and professionals doing modelling. There are a lot of misconceptions in the literature, but in practice primary take home messages can be summarised as follows:

1. What is a model? A model is an “inductive bias” of the modeller, a selected parametrised functions for example, a neural network architecture choice. Contrary to many, specific parametrisation of a model (deep learning architecture) is not a different model.
2. A model’s test and training performance difference is about generalisation gap. Overfitting and under-fitting is not about generalisation gap.
3. Overfitting or under-fitting is a comparison problem: How a model deviates from a reference model? This is called Occam’s gap or so called model selection error.
4. Occam’s gap generalises Empirical Risk minimisation over a learning curve.  Empirical risk minimisation itself is not about learning.

How and when a model generalises well and generalisation of empirical risk minimisation are currently an open research topics.

Saturday, 25 February 2023

Loschimidt's Paradox and Causality:
Can we establish Pearlian expression for Boltzmann's H-theorem?

Boltzmann (Wikipedia)
  • Post covers the papers: H-theorem do-conjecture, M. Süzen,  arxiv:2310.01458 (2023) 

Preamble

Probably the most important achievement for humans is the ability to produce scientific discoveries, that  helps us objectively understand how nature works and build artificial tools where no other species can.  Entropy is an elusive concept and one of the crown achievements of human race. We question here if causal inference and Loschmidt's paradox can be reconciled. 


Mimicking analogies are not physical

Before even try to understand what is a physical entropy, we should make sure that there is only one kind of physical entropy from thermodynamics, formulated by Gibbs-Boltzmann ($S_{G}$ and $S_{B}$).  Other entropies such as Shannon's information entropy are all analogies to physics, and mimicking concepts.

Why counting microstates are associated with time?

The following definition of entropy is due to Boltzmann but Gibbs' formulation tend to provide equivalence, technically different formulations aside, they are actually equivalent.

Definition 1: An entropy of a macroscopic material is associated with larger number of states its constituted elements take different states, $\Omega$. This is associated with $S_{B}$, Boltzmann's entropy.  

Now, as we know from basic thermodynamics classes that entropy change of a system can not decrease, so the time's arrow. 

Definition 2: Time's arrow is identified with change in entropy of material systems, that $\delta S \ge 0$.

We put aside the distinction between open and close systems and equilibrium and non-equilibrium dynamics, but concentrate on how come counting system's state's are associated with time's arrow? 

Loschimidt's Paradox: Irreversible occupancy on discrete states and causal inference

The core idea probably can be explained via discrete lattice and occupancy on them over chain of dynamics. 

Conjecture 1: Occupancy of $N$ items on $M$ discrete states, $M>N$, evolving with dynamical rules $\mathscr{D}$ necessarily increases $\Omega$, compare to the number of sampling if it were $M=N$. 

This conjecture might explain the entropy increase, but irreversibility of the dynamical rule $\mathscr{D}$ is required addressing Loschimidt's Paradox, i.e., how to generate irreversible evolution given time-reversal dynamics. Actually, do-calculus may provide a language to resolve this, by inducing interventional notation on Boltzmann's H-theorem with Pearlian view. The full definition of H-function is a bit more involved, but here we summarise it in condensed form with a do operator version of it.

Conjecture 2 (H-Theorem do-conjecture): Boltzmann's H-function provides a basis for entropy increase, it is associated with conditional probability of a system $\mathscr{S}$ being in state $X$ on ensemble $\mathscr{E}$. Hence, $P(X|\mathscr{E})$. Then, an irreversible evolution from time-reversal dynamics should use interventional notation, $P(X|do(\mathscr{E}))$. Then information on how time reversal dynamics leads to time's arrow encoded on, how dynamics provides an interventional ensembles, $do(\mathscr{E})$.

Conclusion

We provided some hints on why would counting states lead to time's arrow, an irreversible dynamics.  In the light of the development of mathematical language for causal inference in statistics, the concepts are converging. Along with understanding Loschmidt's Paradox via do-calculus, it can establish an asymmetric notation. Loschmidt's question is long standing problem in physics and philosophy with great practical implications in different physical sciences.

Further reading

Please cite as follows:

 @misc{suezen23lpc, 
     title = {Loschimidt's Paradox and Causality: Can we establish Pearlian expression for Bolztmann's H-theorem?}, 
     howpublished = {\url{https://science-memo.blogspot.com/2023/02/loschimidts-do-calculus.html}}, 
     author = {Mehmet Süzen},
     year = {2023}
}  

@article{suzen23htd,
    title={H-theorem do-conjecture},
    author={Mehmet Süzen},
    preprint={arXiv:2310.01458},
    url = {https://arxiv.org/abs/2310.01458}
    year={2023}
}

Saturday, 18 February 2023

Insights into Bekenstein entropy with an intuitive mathematical definitions:
A look into Thermodynamics of Black-holes

Jacob Bekenstein
(Wikipedia)
Preamble

Thermodynamics of black holes has appeared as one of the most interesting areas of research in theoretical physics [Wald1994], specially after LIGO's massive success. The striking results of Jacob Bekenstein  [Bekenstein1973] in proposing a formulation of entropy for a black hole was on of the most striking turning point in building explanations for the thermodynamics of gravitational systems. Bekenstein entropy is defined to be so-called a phenomenological relationship and surprisingly easy to understand concept using basic dimensionality analysis. In this post, we will show how to understand the entropy of a black hole just using basic dimensionality analysis, fundamental physics constants and basic definition of entropy. 

Dimensions and scales

Dimensionality analysis appears in many different areas of physics and engineering, from fluid dynamics to relativity. The starting point is to understand the concept of dimensions. Every quantity we measure in real life has a dimension. It means a quantity $\mathscr{Q}$  we obtain from a measurement $\mathscr{M}$ has a numeric value $v$ and associated unit $u$. $\mathscr{Q}=\langle  v, u \rangle$ given $\mathscr{M}$. There are 3 distinct fundamental unit types length (L),  time (T) and mass (M).

Intuitive Bekenstein entropy (BE) for a black hole : Informal mathematical definition

Black holes are astronomical objects that are not directly observable due to their mass condensed in a small area. The primary object we will use is something called Planck length $L_{p}$ and it implies physically possible smallest patch of the space-time, this is associated with the state of the black holes on their horizon. We won't define the Planck length here in detail but with the knowledge of fundamental physics constants and dimensional analysis we mentioned, one can get a constant value for this length. 

Definition: Finite entropy $S_{f}$ of an object is associated with the number of states $\Omega$ a system can attain.

If we combine this definition for a black hole entropy : 

Definition Finite entropy of a black-hole $S_{f}^{BH}$ is  associated with the number of its states $\Omega$, number of elements on it's surface area of $A$. The elements are discretised with  small patches $a_{p}=L_{p}^{2}$. Then intuitively,  $\Omega$ yields to $A$ divided by $a_{p}$.
  
Bekenstein entropy is not thermodynamic entropy alone and family of Bekenstein entropies

The unit analysis tells us that $A$ has a dimension of length square.  We intentionally omit any equality in the above definition upon $S_{f}^{BH}$ because, in practice Bekenstein Entropy is not thermodynamic entropy alone. The formulation usually presented as BE in general uses equality for the above approach. However this is not strictly thermodynamical alone, that's why we specify definitions as finite entropy and only express the relationship as association. Similarly any other constants as it can yield to different Bekenstein entropies such as introduction of new constants would yield to family of Bekenstein entropies.

Why surface area defines states of a black-hole?

This is an amazing question and Bekenstein's main contribution is to associate this to number of states of a black-hole on event horizon, i.e., point of of no return layer whereby ordinary matter can't return. The justification is that all other properties of black hole defines this surface. Here is the intuitive definition of states of black-hole.

Definition A surface area $\mathscr{A}$ is formed by the set of physical properties forming an ensembles. such as charge density, angular momentum. These ensembles indirectly samples thermodynamics ensembles. 

Even though intuition is there, this question might still be an open question further.

Conclusion

We provided the primary idea that Bekenstein tried to convey in his 1973 paper intuitively. However,  we identify its thermodynamic limit is an open research area. Thermodynamic limit implies that taking infinite limit of both area and the discretised areas, even though it sounds that the values might converge to infinity, simultaneous limit would converge to a finite value for a physical matter. 

Primary Papers
Primary Book

Please cite as follows:

 @misc{suezen23ibe, 
     title = {Insights into Bekenstein entropy with an intuitive mathematical definitions}, 
     howpublished = {\url{https://science-memo.blogspot.com/2023/02/bekenstein-entropy.html}, 
     author = {Mehmet Süzen},
     year = {2023}
  }

Postscript A: 

Information can’t be destroyed


Proposals of that information is destroyed out of thin air is a red flag for any physical theory: this includes theories on evaporating black holes. Bekenstein’s insight in this direction that surface area is associated with entropy. The black-holes’   information in this context is quite different than the Shannon’s entropy. An evaporating black-hole, the area approaching to zero is not the same as information going to zero, surface area is a function of  physical properties of the stellar object that bound  by conservation laws in their interaction with their surrounding. Hence, the information is preserved even if area goes  to zero.


Postscript B: 

What is Holographic principle? its origins from Bekenstein Entropy perspective

The word embedding applies in this context as well. Embedding implies some sort of  dimensionality projection. A projection to lower dimensional space, or on the other end,  to the higher dimensional space. Holography is no different. Imagine taking 2D snap shots of rotating 3D objects, generating this in reverse is the end effect of holographic  reconstruction. N-dimension to (N-1) projection. This is the bases of holographic principle: entropy of black-holes doesn’t appear as all states of its constituted matter,  as normally should have for ordinary matter, it manifest as N-1 projection on it’s surface. This kind of holographic entropy is first noted by Bekenstein; whereby he assigned the event-horizon area as a representation of the states of the black-hole volume. This projection to (N-1)-dimension is improved upon Bekenstein’s approach to generalised situations in explaining how universe might be  a hologram entirely by Gerard 't Hooft and Leonard Susskind. Holographic principle, probably one of the most important development in theoretical physics in recent times.


Saturday, 28 January 2023

Misconceptions on non-temporal learning: When do machine learning models qualify as prediction systems?

Preamble

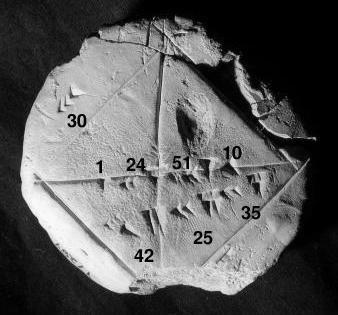
    Babylonian Tablet for 
square root of 2.
 (Wikipedia)
Prediction implies a mechanics, as in knowing a form of a trajectory over time.  Strictly speaking a predictive system implies knowing a solution to the path, set of variable depending on time, time evolution of the system under consideration. Here, we define semi-informally how a prediction system is defined mathematically and show how non-temporal learning can be mapped into a prediction system. 

Temporal learning : Recurrence, trajectory and sequences

A trajectory can be seen as a function of time, identified in recurrence manner. It means $x(t_{i})=f(x_{i-1})$. However, this is one of the possible definitions. The physical equivalent of this appears as a solution to ordinary differential equation, such as the velocity $v(t) = dx(t)/dt$, recurrence on its solution. On the other hand machine learning, an empirical approach is taken and a sequence data such as natural language or a log events occurring in sequence. Any modelling on such data is called temporal learning. This includes classical time-series algorithms, gated units in deep learning and differential equations.

Definition: A prediction system  $\mathscr{F}$ that is build with data $D$ but utilised for a data that is not used in building it $D'$, qualified as such if both $D$ and $D'$ are temporal sets and output of the system is a horizon $\mathbb{H}$, that is a sequence. 

Using non-temporal supervised learning is interpolation or extrapolation

Often practice in industry to turn temporal interactions into flat set of data vectors,  $v_{i}$, $i$ corresponds to a time point or an arbitrary property of the dataset resulting in breaking the temporal associations and causal links.  This could also manifest as set of images with some labels which has no ordering or associational property in the dataset. Even though our system build upon these non-temporal datasets, indeed it constituted a learning systems as interpolation or extrapolation. Their utility in using them for $D'$, strictly speaking does not qualify as prediction systems. 

Mapping with pre-processing

A mapping indeed possible from non-temporal data to a temporal one, if their original form is not in temporal form yet. This is been studied in complexity literature. This requires an algorithm to map flattened data vectors we mentioned into a sequence data. 

Mapping with Causality

A distinct models from causal inference are qualified as predictive systems even if they are trained on non-temporal data, because causality establishes a temporal learning.

Non-temporal modals: Do they still learn?

Even though, we exclude non-temporal model utilisation as non-predictive systems, they still classified as learned models. Because their outputs are generated by a learning procedure. 

Conclusion

Differentiation among temporal and non-temporal learning is provided in associational manner. This results into definition of a prediction system, that excludes non-temporal machine learning models: such as models for unlinked set of vectors, a set of numbers mapped from any data modality. 

Further reading & postscript notes


Tuesday, 20 December 2022

The concept of overgeneralisation and goodness of rank : Overfitting is not about comparing training and test learning curves

Preamble 

    Walt Disney Hall,
Los Angeles  (Wikipedia)


Unfortunately, it is still thought in machine learning classes that overfitting can be detected by comparing training and test learning curves on the single model's performance.  The origins of this misconception is unknown. Looks like an urban legend has been diffused into main practice  and  even in academic works the misconception taken granted. Overfitting's definition appeared to be inherently about comparing complexities of two (or more) models. Models manifest themself as inductive biases modeller or data scientist inform in their tasks. This makes overfitting in reality a Bayesian concept at its core.  It is not about comparing training and test learning curves that if model is following a noise, but pairwise model comparison-testing procedure to select  more plausable belief among our beliefs that has the least information: entities should not be multiplied beyond necessity i.e., Occam's razor. We introduce a new concept in clarifying this practically, goodness of rank to distinguish from well known goodness of fit, and clarify concepts and provide steps to attribute models with overfitted or under-fitted models.

Poorly generalised model : Overgeneralisation or under-generalisation

The practice that is described in machine learning classes, and  practiced in industry that overfitting is about your model following training set closely but fails to generalised in test set. This is not overfitted model but a model that fails to generalise: a phenomena should be called Overgeneralisation (or under-generalisation). 

A procedure to detect overfitted model : Goodness of rank

We have provided complexity based abstract description of model selection procedure, here as complexity ranking: we will repeat this procedure with identification of the overfilled model explicitly.

In the following steps a sketch of an algorithmic recipe for complexity ranking of inductive biases via informal steps, overfitted model identification explicitly:

  1. Define a complexity measure $\mathscr{C}$($\mathscr{M}$) over an inductive bias.
  2. Define a generalisation measure  $\mathscr{G}$($\mathscr{M}$, $\mathscr{D}$) over and inductive bias and dataset.
  3. Select a set of inductive biases, at least-two, $\mathscr{M}_{1}$ and $\mathscr{M}_{2}$.
  4. Produce complexity and generalisation measures on ($\mathscr{M}$, $\mathscr{D}$): Here for two inductive biases: $\mathscr{C}_{1}$, $\mathscr{C}_{2}$,   $\mathscr{G}_{1}$, $\mathscr{G}_{2}$.
  5. Ranking of  $\mathscr{M}_{1}$ and $\mathscr{M}_{2}$:  $argmax \{ \mathscr{G}_{1}, \mathscr{G}_{2}\}$ and $argmin \{ \mathscr{C}_{1}, \mathscr{C}_{2}\}$ 
  6. $\mathscr{M}_{1}$ is an overfitted model compare to $\mathscr{M}_{2}$   if $\mathscr{G}_{1} <= \mathscr{G}_{2}$ and   $\mathscr{C}_{1} \gt \mathscr{C}_{2}$. 
  7. $\mathscr{M}_{2}$ is an overfitted model compare to $\mathscr{M}_{1}$ if $\mathscr{G}_{2} <= \mathscr{G}_{1}$ and   $\mathscr{C}_{2} \gt \mathscr{C}_{1}$.
  8. $\mathscr{M}_{1}$ is an underfitted model compare to $\mathscr{M}_{2}$   if $\mathscr{G}_{1} < \mathscr{G}_{2}$ and   $\mathscr{C}_{1} < \mathscr{C}_{2}$.
  9. $\mathscr{M}_{2}$ is an underfitted model compare to $\mathscr{M}_{1}$   if $\mathscr{G}_{2} < \mathscr{G}_{1}$ and   $\mathscr{C}_{2} < \mathscr{C}_{1}$.
If two model has the same complexity, then much better generalised model should be selected, in this case we can't conclude that either model is overfitted but generalised differently. Remembering that overfitting is about complexity ranking : Goodness of rank.

But overgeneralisation sounded like overfitting, isn't it?

Operationally overgeneralisation and overfitting implies two different things. Overgeneralisation operationally can be detected with a single model. Because, we can measure the generalisation performance of the model alone with data, in statistical literature this is called goodness of fit. Moreover overgeneralisation can also be called under-generalisation, as both implies poor generalisation performance.

However, overfitting implies a model overly performed compare to an other model i.e., model overfits but compare to what? Practically speaking, overgeneralisation can be detected via holdout method, but not overfitting. Overfitting goes beyond goodness of fit to goodness of rank as we provided recipe as pairwise model comparison.

Conclusion

The practice of comparing training and test learning curves for overfitting diffused into machine learning so deeply, the concept is almost always thought a bit in a fuzzy-way, even in distinguished lectures explicitly. Older textbooks and papers correctly identifies overfitting as comparison problem. As a practitioner, if we bear in mind that overfitting is about complexity ranking and it requires more than one model or inductive bias in order to be identified, then we are in better shape in selecting better model. Overfitting can not be detected via data alone on a single model.  


To make things clear, we provide concept definitions.

Generalisation A concept that if model can perform as good as the data it has not seen before, however seen here is a bit vague, it could have seen data points that are close to the data would be better suited in the context of supervised learning as oppose to compositional learning.

Goodness of fit An approach to check if model is generalised well.  

Goodness of rank An approach to check if model is overfitted or under-fitted comparable to other models.

Holdout method A metod to build a model on the portion of available data and measure the goodness of fit on the holdout part of the data, i.e., test and train.

Inductive bias  A set of assumptions data scientist made in building a representation of the real world, this manifest as model and the assumptions that come with a model.

Model  A model is a biased view of the reality from data scientist. Usually appears as a function of observables $X$ and parameters $\Theta$, $f(X, \Theta)$. The different values of $\Theta$ do not constitute a different model.  See also  What is a statistical model?,  Peter McCullagh 

Occam's razor (Principle of parsimony)  A principle that less complex explanation reflects reality better. Entities should not be multiplied beyond necessity.  

Overgeneralisation (Under-generalisation) If we have a good performance on the training set but very bad performance on the test set, model said to overgeneralise or under-generalise; as a result of goodness of fit testing, i.e., comparing learning curves over test and train datasets.

Regularisation An approach to augment model to improve generalisation.

Postscript Notes

Note: Occam’s razor is a ranking problem: Generalisation is not 

The holy grail of machine learning in practice is hold-out methods. We want to make sure that we don’t overgeneralise. However, a misconception has been propagated that overgeneralisation is mistakenly thought of as synonymous with overfitting. Overfitting has a different connotation as ranking different models rather than measuring the generalisation ability of a single model. The generalisation gap between training and test sets is not about Occam’s razor. 

Monday, 5 December 2022

The conditional query fallacy: Applying Bayesian inference from discrete mathematics perspective

Preamble

    The Tilled Field,
Joan Miró
(Wikipedia)
One of the core concepts in data sciences is conditional probabilities, $p(x|y)$ appear as logical description of many of the tasks, such as formulating regression or as a core concept in Bayesian Inference. However, there is operationally no special meaning of a conditional or joint probabilities as their arguments are no more than a compositional event statements. This raise a question: Is there any fundamental relationship between Bayesian Inference and discrete mathematics that is practically relevant to us as practitioners? Since, both topics are based on discrete statements returning a Boolean variables. Unfortunately, the answer to this question is a rabbit hole and probably even an open research.  There is no clearly established connections between discrete mathematics fundamentals and Bayesian Inference.  

Statement mappings as definition of probability 

Statement is a logical description of some events, or set of events. Let's have a semi-formal description of such statements.

Definition: A mathematical or logical statement formed with boolean relationships $\mathscr{R}$ (conjunctions) among set of events $\mathscr{E}$,  so a statement $\mathbb{S}$ is formed with at least a tuple of $\langle \mathscr{R},  \mathscr{E} \rangle$. 

Relationships can be any binary operator and events could explain anything perceptional, i.e., a discretised existence. This is the core discrete mathematics and almost all problems in this domain formed in this setting from defining functions to graph theory. A probability is no exception and definition naturally follows, as so called statement mapping.

Definition: A probability $\mathbb{P}$ is a statement mapping, $\mathbb{P}: \mathbb{S} \rightarrow [0,1]$. 

The interpretation of this definitions that a logical statement is always True if probability is 1 and always False if it is 0. However, having conditionals based on this is not that clear cut.

Conditional Query Fallacy 

A non-commutative statement may imply, reversing the order of statements should not yield to the same filtered set on the data for Bayesian Inference. However, Bayes' theorem would have a fallacy for statement mappings for conditionals in this sense. 

Definition: The conditional query fallacy is defined as one can not update belief in probability, because reversing order of statements in conditional probabilities halts Bayes' update,  i.e., back to back query results into the same dataset for inference.

At first glance, this appears as a Bayes' rule does not support commutative property, practically posterior being equal to likelihood.  However, this fallacy appears to be a notational misdirection. Inference on the filtered dataset back to back constituting a conditional fallacy i.e., when a query language is used to filter data to get A|B and B|A yielding to the same dataset regardless of filtering order. 

Although, in inference with data, likelihood is actually not a conditional probability, strictly speaking and not a filtering operation. It is merely a measure of update rule. We compute likelihood by multiplying values obtained by i.i.d. samples inserted into conjugate prior, a distribution is involved. Hence, the likelihood computationally is not really a reversal of conditional as in $P(A|B)$ written as reversed, $P(B|A)$.  

Outlook

In computing conditional probabilities for Bayesian Inference, our primary assumption is that conditional probabilities; likelihood and posterior are not identical. Discrete mathematics only allows Bayesian updates, if time evolution is explicitly stated with non-commutative statements for conditionals.

Going back to our initial question, indeed there is a deep connection between the fundamentals of discrete mathematics and Bayesian belief update on events as logical statements. The fallacy sounds a trivial error in judgement but (un)fortunately goes into philosophical definitions of probability that simultaneous tracking of time and sample space is not encoded in any of the notations explicitly, making statement filtering definition of probability a bit shaky.

Glossary of concepts

Statement Mapping A given set of mathematical statements mapped into a domain of numbers.

Probability A statement mapping, where domain is $\mathscr{D} = [0,1]$.

Conditional query fallacy Differently put than the above definition. Thinking that two conditional probabilities as reversed statements of each other in Bayesian inference, yields to the same dataset regardless of time-ordering of the queries.

Notes and further reading

(c) Copyright 2008-2024 Mehmet Suzen (suzen at acm dot org)

Creative Commons License
This work is licensed under a Creative Commons Attribution 4.0 International License.