Showing posts with label artificial intelligence. Show all posts

Tuesday, 20 September 2022

Building robust AI systems: Is an artificial intelligent agent just a probabilistic boolean function?


Preamble
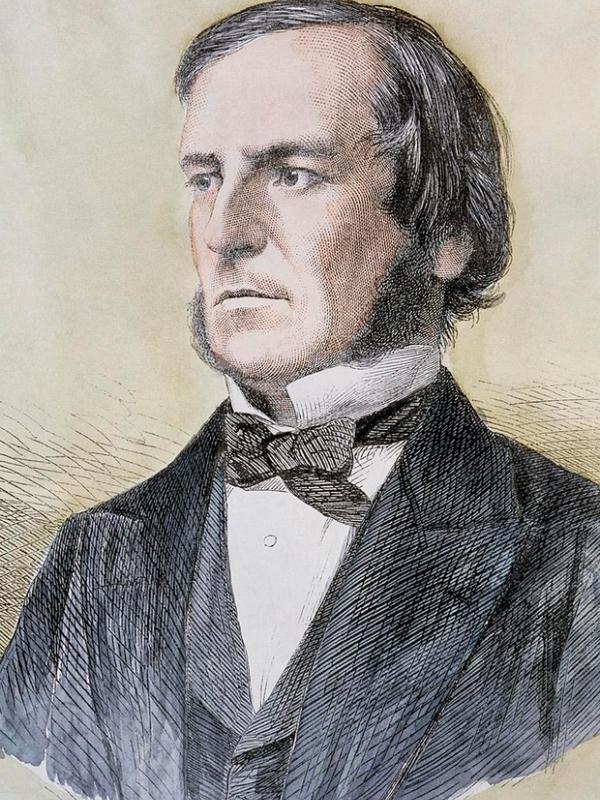
    George Boole (Wikipedia)

Agent, AI agent or an intelligent agent is used often to describe algorithms or AI systems that are released by research teams recently. However, the definition of an intelligent agent (IA) is a bit opaque. Naïvely thinking, it is nothing more than a decision maker that shows some intelligent behaviour. However, making a decision intelligently is hard to quantify computationally, and probably IA for us is something that can be representable as a Turing machine.  Here, we argue that an intelligent agent in the current AI systems should be seen as a function without side effects outputting a boolean output and shouldn't be extrapolated or compare to human level intelligence.  Causal inference capabilities should be seen as a scientific guidance to this function decompositions without side-effects,  i.e., Human in-the loop Probabilistic Boolean Functions (PBFs).

Computational learning theories are based on binary learners

Two of the major  theories of statistical learning PAC and VC dimensions build upon on "binary learning".  

PAC stands for Probably Approximately Correct, It sets basic framework and mathematical building blocks for defining a machine learning problem from complexity theory. Probably correct implies finding a weak learning function given binary instance set $X=\{1,0\}^{n}$. The binary set or its subsets mathematically called concepts and under certain mathematical conditions a system said to be PAC learnable. There are equivalences to VC and other computation learning frameworks. 

Robust AI systems: Deep reinforcement learning and  PAC

Even though the theory of learning on deep (reinforcement) learning is not established and active area of research. There is an intimate connection with composition of concepts, i.e., binary instance subsets as almost all operations within  deep RL can be viewed as probabilistic Boolean functions (PBFs). 

Conclusion 

Current research and practice in robust AI systems could focus on producing learnable probabilistic boolean functions (PBFs) as intelligent agents, rather than being a human level intelligent agents. This modest purpose might bring more practical fruit than long-term aims of replacing human intelligence. Moreover, theory of computation for deep learning and causality could benefit from this approach. 

Further reading


Friday, 11 February 2022

Physics origins of the most important statistical ideas of recent times

Figure: Maxwell's handwritings, 
state diagram (Wikipedia)


Preamble

The modern statistics now move into an emerging field called data science that amalgamate many different fields from high performance computing to control engineering. However, the emergent behaviour from researchers in machine learning and statistics that, sometimes they omit naïvely and probably unknowingly the fact that some of the most important ideas in data sciences are actually originated from Physics discoveries and specifically developed by physicist. In this short exposition we try to review these physics origins on the areas defined by Gelman and Vehtari (doi). Additional section is also added in other possible areas that are currently the focus of active research in data sciences. 

Bootstrapping and simulation based inference : Gibbs's Ensemble theory and Metropolis's simulations


Bootstrapping is a novel idea of estimations with uncertainty with given set of samples. It is mostly popularised by Efron and his contribution is immense, making this tool available to all researchers doing quantitative analysis.  However, the origins of bootstrapping can be traced back to the idea of ensembles in statistical physics, which is introduced by J. Gibbs. The ensembles in physics allow us to do just what bootstrapping helps, estimating a quantity of interest with sub-sampling, in the case of statistical physics this appears as sampling a set of different microstates. Using this idea Metropolis devised a inference in 1953, to compute ensemble averages for liquids using computers.  Note that, usage of Monte Carlo approach for pure mathematical nature, i.e., solving integrals, appear much earlier with von Neumann's efforts.

Causality : Hamiltonian systems to Thermodynamic potentials

Figure: Maxwell 
Relations as causal
diagrams.
Even though the historical roots of causal analysis in early 20th century attributed to Wright 1923 for his definition of path analysis, causality was the core tanents of Newtonian mechanics in distinguishing left and right of the equations of motions in the form of differential equations, and the set of differential equations following that with Hamiltonian Mechanics is actually forms a graph, i.e., relationships between generalised coordinates, momentum and positions. This connection is never acknowledge in early statistical literature, and probably causal constructions from classical physics were not well known in that community or did not find its way to data-driven mechanics. Similarly, causal construction of thermodynamic potentials appear as a directed graph as in, Born wheel. It appears as a mnemonic but it is actually  causally constructed via Legendre Transformations.  Of course, causality, philosophically speaking, is discussed since Ancient Greece but here we restrict the discussion on solely quantitative theories after Newton.

Overparametrised models and regularisation : Poincaré classifications and astrophysical dynamics

The current deep learning systems classified as massively overparametrized systems. However, the lower dimensional understanding of this phenomenon were well studied by Poincare's classification of classical dynamics, namely the measurement problem of having overdetermined system of differential equations, i.e., whereby inverse problems are well known in astrophysics and theoretical mechanics.     

High-performance computing: Big-data to GPUs

Similarly, using supercomputers or as now we call it high-performance computation with big data generating processes were actually can be traced back to Manhattan project and ENIAC that aims solving scattering equations and almost 50 years of development on this direction before 2000s. 

Conclusion

The impressive development of new emergent field of data science as a larger perspective of statistics into computer science have strong origins from core Physics literature and research. These connections are not sufficiently cited or acknowledged. Our aim in this short exposition is to bring these aspects into the attention of data science practitioners and researchers alike.

Further reading
Some of the mentioned works and related reading list, papers or books.

Please cite as follows:

 @misc{suezen22pom, 
     title = { Physics origins of the most important statistical ideas of recent times }, 
     howpublished = {\url{http://science-memo.blogspot.com/2022/02/physics-origins-of-most-important.html}, 
     author = {Mehmet Süzen},
     year = {2022}
  }
Appendix: Pearson correlation and Lattices

Auguste Bravais is famous for his contribution in foundational work on the mathematical theory for crystallography, now seems to be going far beyond periodic solids. Unknown to many, he actually first driven the expression for what we know today as correlation coefficient or  Pearson’s correlation or less commonly Pearson-Galton coefficient. Interestingly, one of the grandfathers of causal analysis Wright is mentioned this in his seminal work of 1921 titled “Correlation and causation” acknowledged Bravais for his 1849 work as the first derivation of correlation.

Appendix: Partition function and set theoretic probability

Long before Kolmogorov set forward his formal foundations of probabilities, Boltzmann, Maxwell and Gibbs build theories of statistical mechanics using probabilistic language and even define settings for set theoretic foundations by introducing ensembles for thermodynamics. For example, partition function (Z) appeared as defining a normalisation factor that summation of densities should yield to 1. Apparently Kolmogorov and contemporaries inspired a lot from physics and mechanics literature.

Appendix: Generative AI

Of course now generative AI took over the hype. Indeed physics of diffusion from Fokker-Planck equation to basic Langevin dynamics is leveraged.  
 
Appendix: Physics is fundamental for the advancement of AI research and practice 


AI as a phenomena appears to be in the domain of core physics. For this reason, studying physics as a (post)-degree or as a self-study modules will give students and practitioners alike a definitive cutting-edge insights.  

  • Statistical models based on correlations originates from physics of periodic solids and astrophysical n-body dynamics.
  • Neural networks originates from the modelling magnetic materials in discrete states and later named as cooperative phenomenon. Their training dynamics closely follows free-energy minimisation.
  • Causality roots in ensemble theory of physical entropy.
  • Almost all sampling based techniques are based on the idea of sampling  physics of energy surfaces, i.e. Potential Energy Surfaces. (PES).
  • Generative AI  originates from physics of diffusion of fluids: classical  Liouville description of the classical mechanics, i.e, phase-space flows and generalised Fokker-Planck dynamics. 
  • Language models based on attention are actually coarse-grained entropy-dynamics
    introduced by Gibbs: ‘Attention Layers’ behaves as coarse-graining procedure, i.e, compressed
    causal graphs mapping.

This is not about building analogies to physics but as foundational topics to AI.

Wednesday, 28 July 2021

Deep Learning in Mind a Gentle Introduction to Spectral Ergodicity

Preamble

    Figure: Monalisa on
Eigenvector grids (Wikipedia)

In the post, A New Matrix Mathematics for Deep Learning : Random Matrix Theory of Deep Learning, we have outlined a new mathematical concepts that are aimed at deep learning but in general belonging to applied mathematics. Here, we dive into one of the concepts,  spectral ergodicity. We aimed at conveying what does it mean and how to compute spectral ergodicity for a set of matrices, i.e., ensemble. We will use a visual aid and verbal descriptions of steps to produce a quantitative measure of spectral ergodicity. 

The idea of spectral ergodicity comes from quantum statistical physics but it is recently revived for deep learning as a new concept in order to accommodate mathematical needs of explaining and understanding the complexity of deep learning architectures.

Understanding Spectral Ergodicity

The concept of ergodicity can get quiet mathematical even for a professional mathematician.  A practical understanding of ergodicity  could lead to the law of large numbers statistically speaking. However, observed ergodicity for ensemble of matrices, i.e. over their eigenvalue spectrum, are not formally defined before in the literature, and only appeared in statistical quantum mechanics in a specialised case.  Here we do a formal definition gently.

The spectral ergodicity of snapshot of values from $M$ matrices, where they are $N \times N$ sizes,  denoted by $\Omega$, can be produce with the following steps:
  1. Compute eigenvalues of $M$ matrices separately.  
  2. Produce equidistance spectra of matrices out of eigenvalues, i.e., histograms with $b_{k}$ bins. Each cell in the Figure corresponds to bin in the spectra of the matrices. 
  3. Compute average values over each bin across  $M$ matrices.
  4. Computing root mean square deviation that went to each bin from $M$ matrices from corresponding ensemble averaged value and average over $M$ and $N$. This will give a distribution, $\Omega=\Omega(b_{k})$, which represents spectral ergodicity value, think as a snapshot value of a dynamical process.
Attentive reader would notice that normally, measures of ergodicity leads to a single value, such as in spin-glasses, but here we obtain ergodicity as a measure distribution. This stems from the fact that our observable is not univariate but it is a multivariate measure over spectra of the matrix, i.e., bins in the histogram of eigenvalues.  

Why spectral ergodicity important for deep learning? 

The reason why this measure is so important lies in dynamics and consistency in measuring observables (no nothing to do with quantum mechanics but time and ensemble averages classically). Normally we can't measure ensemble averages. In experimental conditions the measurement we do is usually a time averaged value. This is exactly what happens when we train deep neural network, i.e, ergodicity of weight matrices. Essentially, spectral ergodicity would capture deep neural network's characteristics.
Outlook

The way we express spectral ergodicity here would only consider all layer having the same size.  One would need a more advanced computation of spectral ergodicity for more realistic architectures, which is called cascading Periodic Spectral Ergodicity measure suitable as a complexity measure for deep learning.  The computation of such measure is more involved and spectral ergodicity we cover here is the first step.

Cite this post with  Deep Learning in Mind Very Gentle Introduction to Spectral Ergodicity, Mehmet Süzen, (2021) https://science-memo.blogspot.com/2021/07/deep-learning-random-matrix-theory-spectral-ergodicity.html 

Saturday, 20 March 2021

Computable function analogs of natural learning and intelligence may not exist


Optimal learning : Meta-optimization

Many papers directly equate “machine” learning problem, algorithmic learning oppose to human or animal learning, with optimisation problem. Unfortunately, contrary to common belief  machine learning is not an optimisation problem. For example, take optimal learning strategy, a replace learning with optimisation and we end up having and absurd terms of optimal optimisation strategy at one point. 

Turing machine (Wikipedia)
Sound like practiced machine learning is a meta-optimisation problem, rather than a learning as humans do.

Computable functions to learning

Fundamentally, we do not know how human learning can be mapped into an algorithm or if there are computable function analogs of human learning or if human intelligence and its artificial analog can be represented as Turing computable manner.

Thursday, 3 December 2020

Resolution of the dilemma in explainable Artificial Intelligence:
Who is going to explain the explainer?

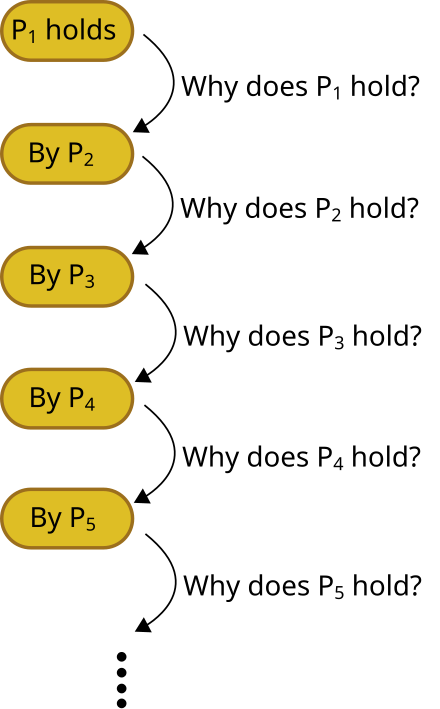
Infinite Regress
 Figure: Infinite
Regress (Wikipedia)
Preamble 

Surge in usage of artificial intelligence (AI) systems, now a standard practice for mid to large scale industries. These systems can not reason by construction and the legal requirements dictates if a machine learning/AI model made a decision, such as granting a loan or not for example, people affected by this decision has right to know the reason. However, it is well known that machine learning models can not reason or provide a reasoning out of box.  Apart from modifying conventional machine learning systems that includes some form of reasoning as a research exercise, practicing or building so called explainable or interpretable machine learning solutions are very popular on top of conventional models. Though there is no accepted definition of what should entail an explanation of the machine learning systems, but in general, this field of study is called explainable  artificial intelligence.

One of the most used or popularised set of techniques essentially build a secondary model on top of the primary model's behaviour and try to come up with a story on how the primary model, AI system, brought up its answers. However, this approach sounds like a good solution at the first glance, it actually trapped us into an infinite regress, a dilemma: Who is going to explain the explainer?

Avoiding 'Who is going to explain the explainer?' dilemma

Resolution of this lies in completely avoiding explainer models or techniques rely on optimisations of a similar sort. We should rely on solely so called counterfactual generators. These generators rely on a repetitive query to the system to generate data on the behaviour of the AI system to answer what if scenarios or a set of what if scenarios, corresponding to a set of reasoning statements. 

What are counterfactual generators?

Figure: Counterfactual generator,
instance based.

These are techniques that can generate a counter factual statement on the predicted machine learning decision. For example for a loan approval model, a counterfactual statement would be 'If applicants income was 10K more a model would have approved the loan". A simplest form of counterfactual generator one can think of is Individual Conditional Expectation (ICE) curves [ Goldstein2013 ], ICE curves shows, what would happen to model decision if one of the feature, such as income, vary over set of values. The idea is simple but it is so powerful that, one can generate dataset for counterfactual reasoning, so the name counterfactual generator. These are classified as model agnostic methods in general [ Du2020, Molnar ] but distinction here we are  trying to make is avoiding building another model to explain the primary model but we solely rely on queries to the model. This rules out LIME, as it relies on building models to explain the model, we question that if linear regression is intrinsically explainable here [Lipton]. One extension to ICE is generating a falling list [ wang14 ] outputs without building models.
 
Outlook

We rule out of using secondary machine learning models or any models, including simple linear regression, in building an explanation for machine learning system. Instead we claim that reasoning can be achieved a simplest level with counterfactual generators based on systems behaviour to different query sets. This seems to be a good direction, as reasoning can be defined as  "algebraically manipulating previously acquired knowledge in order to answer a new question" by Léon Botton [ Botton ] and of course partly inline with Judea Pearl's causal inference revolution, though replacing the machine learning model with the causal model completely would be more causal inference recommendation.

References and further reading

[ Goldstein2013 ] Peeking Inside the Black Box: Visualising Statistical Learning with Plots of Individual Conditional Expectation, Goldstein et. al. arXiv
[ Lipton ] The Mythos of Model Interpretability, Z. Lipton arXiv
[ Molnar ] Interpretable ML book, C. Molnar url
[ Botton ] From machine learning to machine reasoning An essay, Léon Bottou doi
[ Du2020 ] Techniques for Interpretable Machine Learning, Du et. al, doi
[ wang14 ] Falling Rule Lists, Wang-Rudin arXiv


Monday, 22 October 2012

Hands on Crash Tutorial for Supervised Learning : Multinomial Logistic Regression (MNL)

If you are a computer scientist, probably you would call a task supervised learning what others might call classification based on data. Data being anything that has a well defined structure and associated classes. We will work on hands on example for multi-class prediction with logistic regression i.e. multinomial logistic regression (MNL). What I meant by multi-class is here that we have $k \in \bf{Z}$ distinct classes for each observation, $k>1$. Actually if you think in terms of link functions from Generalized Linear Models (GLMs), the support of the distribution will tell you the distinction of the nature of the class. In statistics literature classes can be manifest as factors (or categories).

The following pointers would be helpful before you read further. From R perspective, I'd suggest German Rodrigez's notes for background reading. Data mining blog by Will Dwinnell is one of the clear descriptions in this direction for MATLAB. For sure, an authoritative resource on this is the book by Hastie et. al. called elements of statistical learning, you can obtain it from their Stanford page. An other excellent resource from Professor Ripley of Oxford, his books and R packages are known to be de facto standard in the field, particularly here I refer to nnet and applied statistics book.


Recall that a design matrix $\bf{X}$ is noting more then set of observations ($n$) in the rows. Observables ($p$) are placed along columns. The idea of supervised learning is that we train our model, here we choose to be multinomial GLM, against a data set and obtain coefficients of the model (parameters).  Let's do this with the simplest possible example. (R codes start with '>' and MATLAB '>>')


Statistical toolbox brings set of functionality to do multinomial logistic regression. mnrfit is the main function we would like to use. Lets use a simple data set, it is trivial and the statistics we would get from this data might be very poor, but we aimed at the concept in this post.

>>  X  =  [0.0 0.1 0.7 1.0 1.1 1.3 1.4 1.7 2.1 2.2]'; % design matrix

>>  Y  =  [1 2 1 3 1 2 1 3 1 1]'; % associated classes 

We can split this set to training and validation data set by choosing


>> trainIndex = [2 8 10 4 5];
>> validIndex = [1 3  6 7 9];


Now we can obtain the coefficients via mnrfit.


>>  betaHat    = mnrfit(X(trainIndex), Y(trainIndex), 'model', 'ordinal', 'interactions', 'off', 'link', 'logit');

Note that, model is ordinal, meaning that it takes discrete values. Switched off interactions generates only one coefficient per class (betaHat vector).  Then we can get the probabilities for the validation set.

>> predictProbs=mnrval(betaHat, X(validIndex), 'model', 'ordinal', 'interactions', 'off', 'link', 'logit');

ans =

    0.2980    0.1958    0.5061
    0.3636    0.2041    0.4324
    0.4242    0.2045    0.3713
    0.4346    0.2039    0.3615
    0.5084    0.1954    0.2961


So the highest probabilites form this matrix will give us [3, 3, 1, 1, 1] predictive set. With this approach we have predicted last two classes correctly.

Let's do this same example with R, even though the following approach may not be exactly the same procedure described above, however this is multinomial as well:
> require(nnet)
> # Design Matrix: 10 observations
> X            = matrix(c(0.0, 0.1, 0.7, 1.0, 1.1, 1.3, 1.4, 1.7, 2.1, 2.2));
> # Corresponding Classes: 3 ordinal classes
> Y            =  matrix(c(0, 1, 0, 0,
                                     0, 0, 1, 0,
                                     0, 1, 0, 0,
                                     0, 0, 0, 1,
                                     0, 1, 0, 0,
                                     0, 0, 1, 0,
                                     0, 1, 0, 0,
                                     0, 0, 1, 0,
                                     0, 1, 0, 0,
                                     0, 1, 0, 0  

                                    ), nrow = 10, ncol=4, byrow=TRUE)
 

Similarly we can obtain training and validation sets

># Generate training and validation data sets for X, Y
> trainIndex   = c(2, 8, 10, 4, 5);

> validIndex   = c(1, 3, 6, 7, 9);
Now, we can use nnet package fitting function for multinomial log-linear.

> mfit = multinom(formula = Y[trainIndex, ] ~ X[trainIndex] + 0)

Note that we put 0 for the intercepts while first column of Y is dummy. 

> predict(mfit, X[validIndex])
[1] 2 2 2 2 2


Resulting classification is not that great. The above example shown a basic approach to supervised learning in MATLAB and R. However, one must check statistical values, like residuals, deviance, p-values etc. for the quality of results. 


Sunday, 13 March 2011

Universal Intelligence

Turing test is maybe the core concept of artificial intelligence. A recent work that claims to extent context of Turing test is titled:Measuring universal intelligence: Towards an anytime intelligence test. The primary contribution of this research by Oralloa and Doweb is centred around the applicability of the Turing test to any type of intelligence via employing Kolmogorov complexity .
(c) Copyright 2008-2024 Mehmet Suzen (suzen at acm dot org)

Creative Commons License
This work is licensed under a Creative Commons Attribution 4.0 International License.